Making important decisions about your business is easier when you have good data about what’s working and what’s not. How should I spend my marketing budget? Should I change my business hours? Is my pricing right? I am overbooked, is it time to hire an employee? How much can I afford to pay for this commercial space? PocketSuite’s Smart Reports go beyond the basics and help you answer important business questions so that you can make data-driven decisions about your clients, income, and the future.
Here are a few of the questions PocketSuite’s Smart Reports can help you answer about your business (and these are just the beginning!):
1. What are my most popular services?
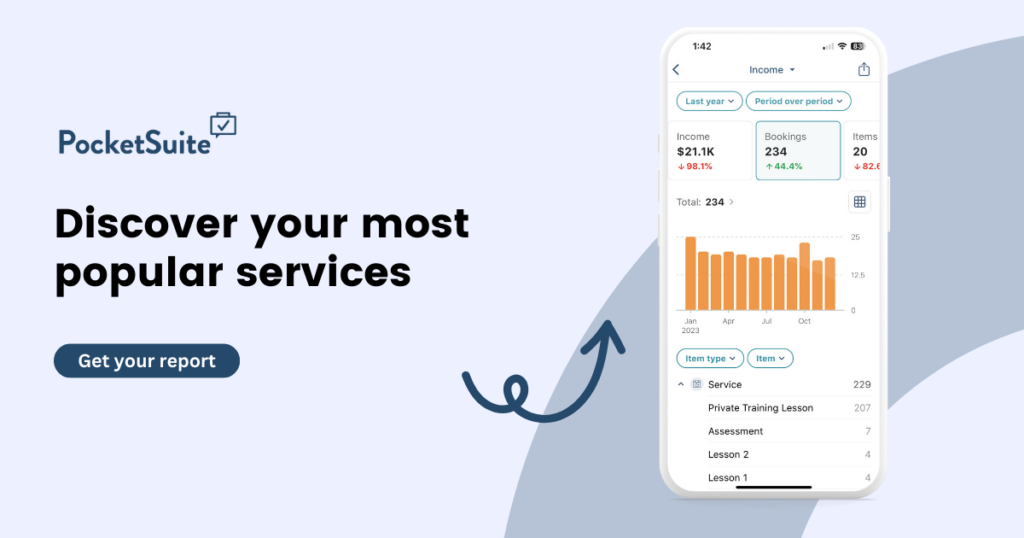
You might be looking to run a sale to attract new clients. Maybe you’re hiring and want your new employee to have expertise to deliver your most in-demand services. Or perhaps you need to know how best to stock up on product inventory. Using the Total Items Sold and Income metrics, you can see not only how much money you made from each item, but also how many you sold. To see your most popular services and items, you can also use the Number of Bookings metric. Then group your data by Item (i.e., specific service, class, or reservation). You can even view your data by booking category to see if there is a type of service that is more profitable than others.
2. Who are my most loyal clients?
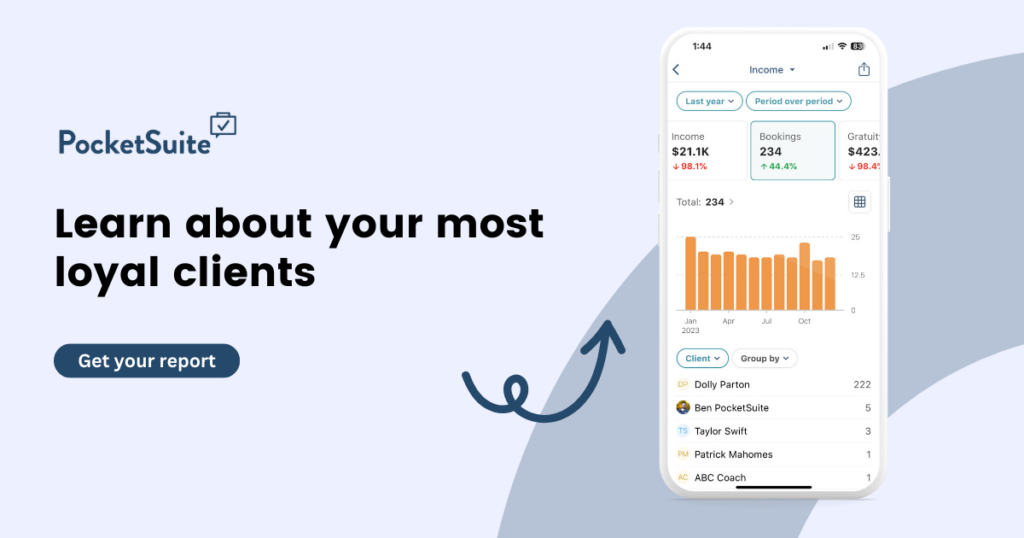
Loyal clients are essential for any successful business. Knowing who your clients are and what they value is the key to getting the right new client leads, retaining their business, and encouraging repeat purchases. There are a number of metrics that can help you answer this question.
You can review metrics such as Income, Number of Bookings, and Gratuity to measure customer loyalty. Group these by Client to find out who your most loyal clients are. You can also group by Lead Source to determine which lead sources send you the highest quality leads.
Pro tip: Group by Client City to see where your most valuable leads come from so that you know in which geographies to target your market budget.
3. How much does it cost me to get a new client?
Knowing how much it costs to acquire a new client is crucial for evaluating the effectiveness of your current marketing strategy. By tracking your client acquisition cost, you can determine which marketing channels are delivering the most valuable clients and focus your budget on those sources. When you set the lead source for clients and set the cost for that lead, you can use the Client Acquisition Cost metric to see your total acquisition costs. Compare this with the Number of New Clients metric to see the returns you are getting on your investment. Try grouping by Lead Source to discover your most cost-effective lead sources!

4. Do clients who find me from specific marketing channels value different things?
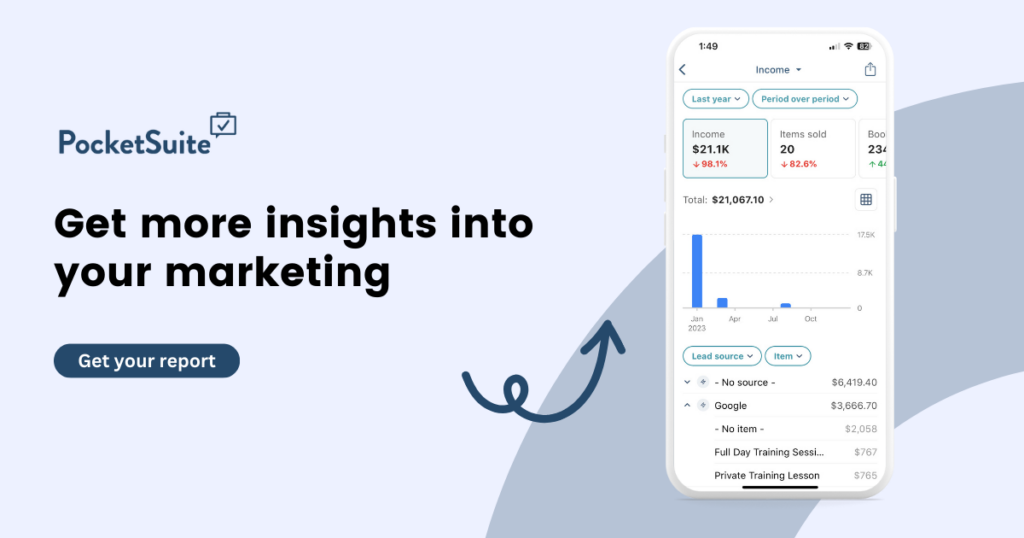
Many businesses serve a diverse group of clients, and it’s important, especially in marketing, to know which items sell the best with different types of clients. Try analyzing the most popular services based on different lead sources to focus on those products and services that your clients value most.
Add the Income, Total Items Sold, and Number of Bookings metrics to your report. Then group your data by Lead Source and Item. This will show you which items you sold the most based on which channel those clients came through. This report will show you which specials to run on different social media and marketing channels!
5. What percentage of my new leads become paying clients?
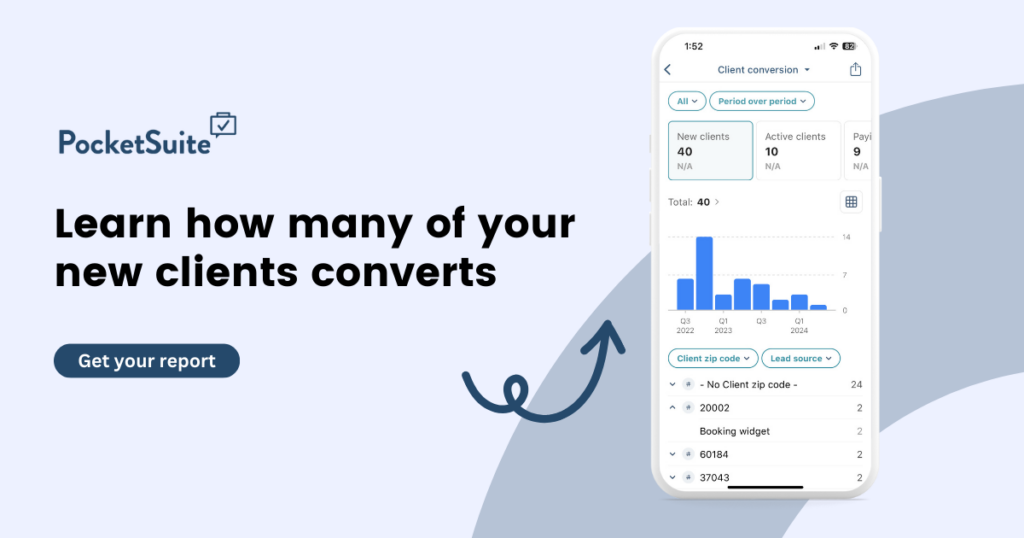
Understanding your new paying client conversion rates can help you identify areas for improvement in your new client onboarding and sales process. By reviewing reports on conversion rates, you can identify which lead sources are converting the most paying customers and revise your marketing and sales strategies to improve conversion rates for underperforming services. PocketSuite has already built this report out for you. From the Income dashboard, simply tap Income at the top to switch reports. Tap Client Conversion from the report list to see the number of new clients you added, and how many of those clients you added have become active or paying clients.
6. What are my busiest times of day/week/month?
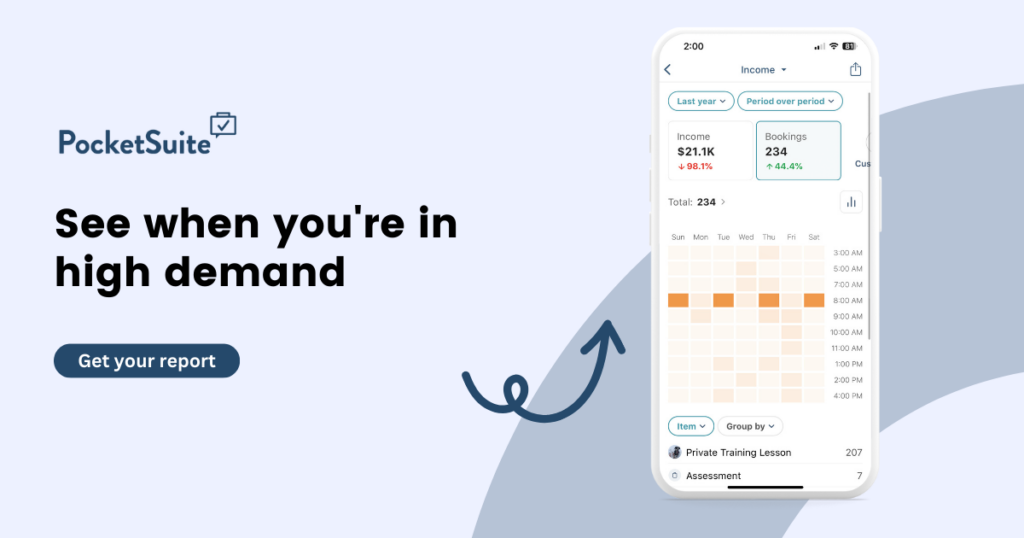
Knowing when your business is busiest can help you better manage your time as well as the availability of your team and resources. Having data on customer bookings and purchasing trends, will help you identify the busiest times of day, week, and month and adjust your operating hours to meet that demand. The heat map helps you see which days and times during a typical week have the most bookings or bring in the most income. Use the Income or Number of Bookings metrics and group by any dimension you wish. The heat map will show you which days of the week and what time of day your schedule was most utilized. If you offer classes or reservations, you can also see your utilization for those metrics specifically.
7. Which services have the lowest cancellation rate?
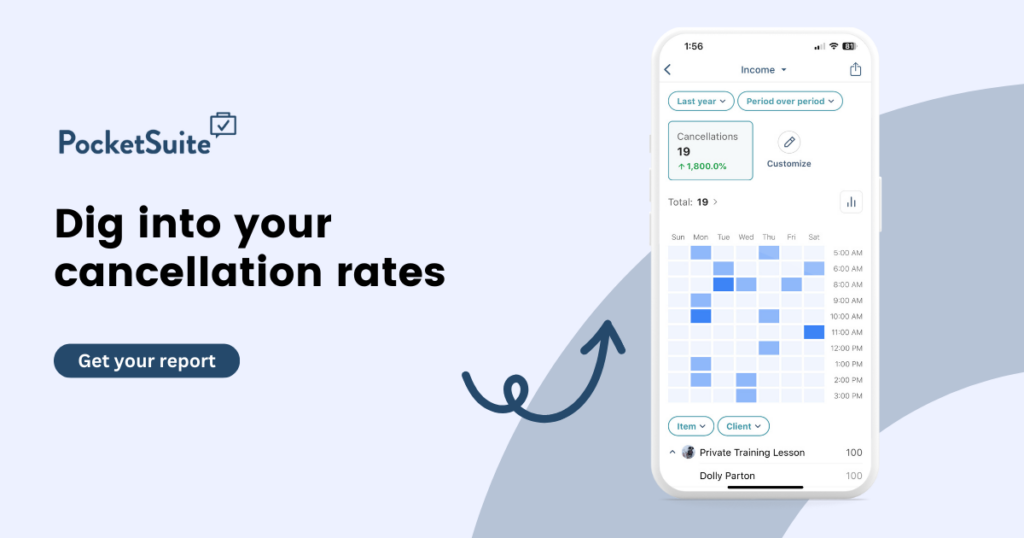
Even with PocketSuite’s cancellation features, cancellations can cause you to lose expected income. Understanding which services are most likely to be canceled or which clients are most likely to cancel can help you focus your business on the services and clients who consistently deliver value for your business. Add the Number of Cancellations metric and group it by Item or Client to see which services or clients cancel the most so you can take the necessary actions to protect your business.
8. How has my business grown over time?
Even if you’re still working toward your long-term business goals, it’s always important to see the progress that you have made over time. You can set custom date ranges to see how much income you have made during any past time period. Whether you want to view Income or see the change in your Number of Bookings or Number of Paying Clients, you can use both built-in and custom date ranges to see how your business has changed over time.
With each metric you add, you’ll also be able to see the change over time, shown by the percentage change under each metric. You can choose between a Period over Period or Year over Year comparison. Period over Period shows you the difference in your data from the previous comparable time period. For example, If you’re viewing your data month to date, a period over period comparison would show you the change from the previous month up to the same day of the month. Year over year shows you the change from last year. You can even tap into your grouped metrics to see the specific change for each group.

9. How can I book more of my available operating hours?
Knowing how many bookings you have or how much income you’ve made is only part of what goes into understanding the health of your business. PocketSuite’s Capacity metric shows you the percentage of your available hours that have actually been booked. View this data with our heat map to see which hours of the day and days of the week you’re most booked. This important metric helps you understand where there are gaps in your schedule and when you have the most demand so that you can make important decisions about your availability, staffing, or even offer deals/promotions for certain slow days.

10. How many of my clients are repeat clients?
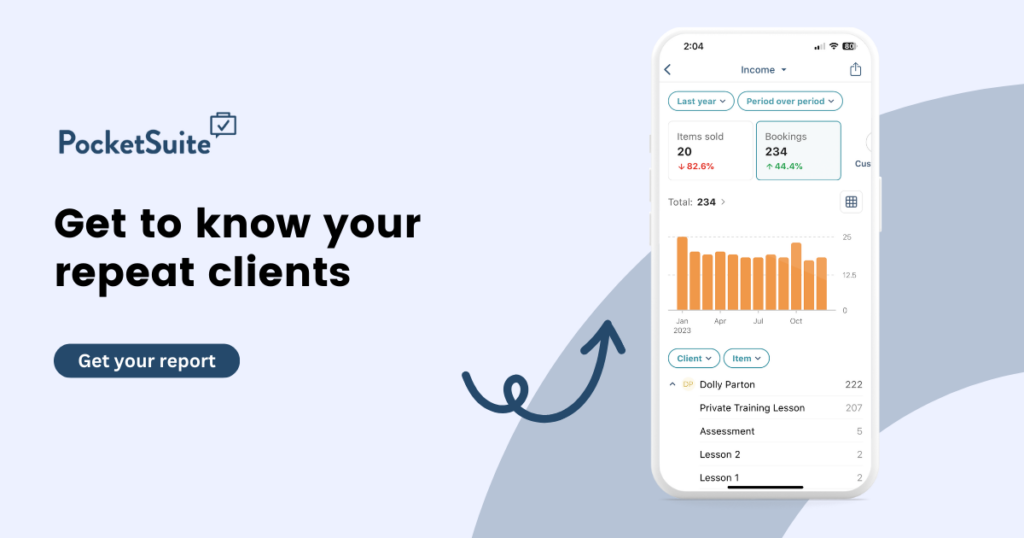
Repeat clients are the most important clients you have as they help you sustain your income over time and don’t require more of your selling time in order to get them to book you again and again. Use the Number of Bookings and Number of Items Sold metrics, restricted to a smaller time period such as a specific week or month, and group by Client to see which clients are booking or purchasing items from you on a regular basis. You can also group by Item to see which items clients are most likely to purchase repeatedly.
Asking the right questions about your business and analyzing the data can provide valuable insights that will help you make informed decisions and drive your success. By regularly asking these questions and reviewing the reports recommended above, you can identify areas for improvement and take proactive steps to grow your business and better serve your clients.
Pro tip: For easy access to any report in PocketSuite, you can save custom reports at any time by tapping the arrow in the upper right corner of the Smart Reports dashboard. Once you add new metrics or change groupings, you can save it as a new report and find it in your reports list (found by tapping the arrow at the top of the screen) in the future, so you don’t need to rebuild reports in the future!


